
Divinity Introduction
Divinity is a trading algorithm I developed with the ultimate goal of improving my python and software engineering skills, while teaching me more about investing. It works by using a univariate time series prediction model to predict the current days price of a security (ie, a stock). Confidence intervals (CIs) are built around the prediction which are used to indicate if a price is impropable, or in other words, extreme. When the price is extreme (it falls outside of the CIs) it is expected to eventually return closer to the predicted value. To indicate this change in price, two moving averages (one faster than the other) are used and a cross indicates a buy or a sell. In the rest of this document I’ll walk you through my decision making in developing divinity and why certain design choices were made.
It was written all in Python and is executed daily at market close using an AWS EC2 instance with a cron-job.
Before we get started, my current boss (Doug Ruderfer) has some guiding principles that highly impacted the development of this algorithm: do the easiest thing possible with the highest impact. That is to say every aspect of this project will be difficult, so the easiest next step will tend to be the most impactful. This is roughly Occams razor. Following these principles, I designed divinity to be modular and iterable to allow for ease of integrating new and improved version of the algorithm. These themes will come up multiple times in this post.
Data collection
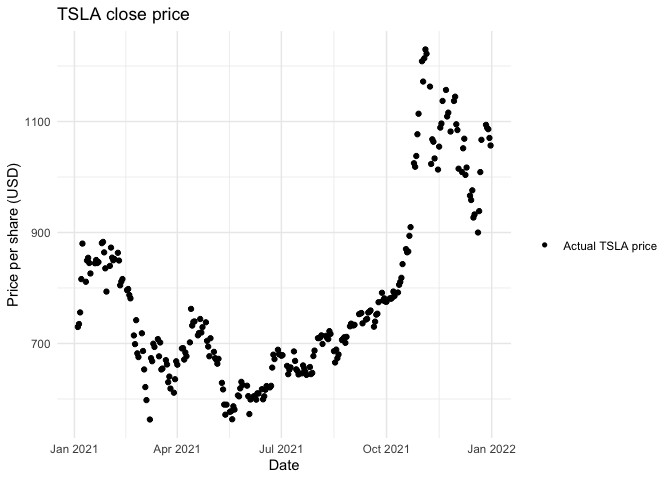
Getting consistent, reliable, and low-latency price data is not cheap since they are gatekeeped by large financial institutions. This was a blessing in disguise as using live intra-day data is complicated and that goes against the principles outlined above. Instead, daily close price of any security can be acquired from python’s yfinance library. This approach has a lot of downstream benefits that will keep things simple and can be changed as the model is developed further.
Close price was selected for a few reasons, but mostly ease of use. In brief, price spreads are lower in the afternoons and markets can change drastically pre-market open. Using the close price reduces the immediate need for a more complex buy/sell algorithm to maximize gains if the spread is wide. This will be modified in the future.
Statistical theories underlying divinity
There are many approaches we can take to model price changes in the value of a stock, but some are more complicated than others. Instead of building a convolutional neural network from scratch or another unecessarily black box model, I wanted to use something more straightforward. In comes regression to the mean (also called mean reversion).
Regression to the mean in it’s simplest terms is the idea that extreme values will return to average over time. For example, if you randomly sampled 10 IQs from US highschool students and their average score was 130 (the top 97.5% of the population), then there is an increased likelihood the next 10 students’ IQ will be closer to the mean of 100.
Time series prediction
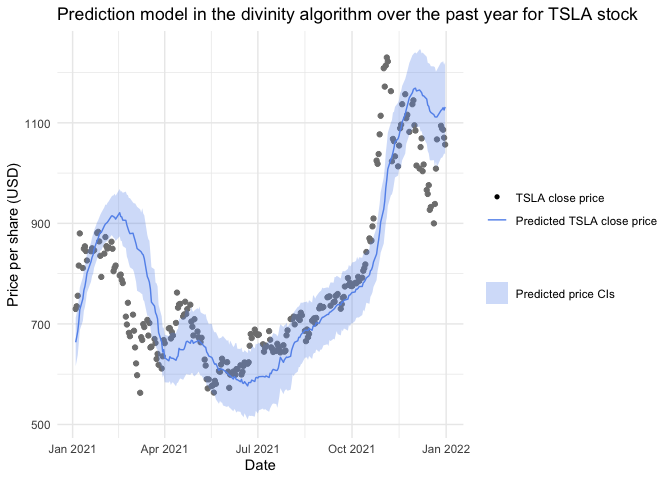
To implement a mean reversion strategy I decided on using a prebuilt, well validated, univariate time series prediction model (ARIMA). The best choice was Facebook’s Prophet model. The model will predict today’s current price and we’ll think of that as the mean value. The prediction model will produce confidence intervals which are a measure of probability (or confidence) that the true price falls within this range. If the true price is well above or well below the expected price we can interprate it as being extreme. This indicates it will return to the predicted value soon and give us our first signal.
Although facebook’s prophet model is techinically a “prediction” model, no forecasting of future prices will be done. If billion dollar hedge funds can’t predict future prices then it’s too complicated for me. All we need is a prediction of the current price and a little statistical theory.
Signal detection
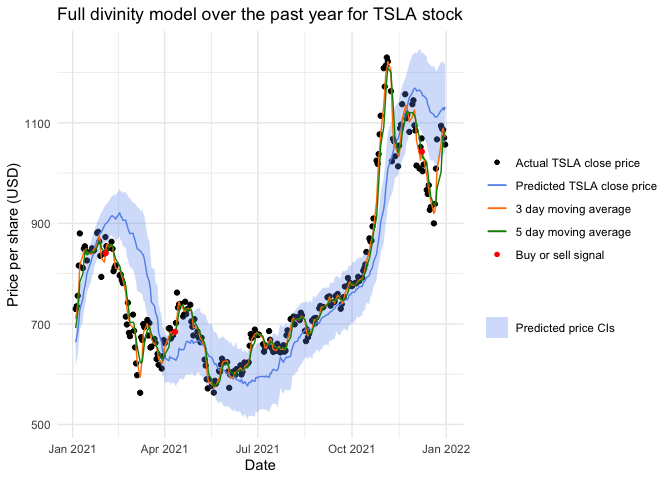
When looking at the plot above it is clear that having the price fall above or below the CIs is not a clear enough signal for price change. To remedy this, I used two technical indicators in a cross-strategy as a signal. One is an average of the last 3 days, the other an average of the last 5 days. When they cross it indicates a change in price and therefore a signal to buy or sell. Typically a cross-strategy is either overly sensitve or too conservative, but when pairing it with the confidence intervals of the prediction model, this should be less of an issue.
Calculating the point at which the points cross comes down to calculating when two lines cross. Add these to the algorithm and you have the current final iteration.
Logistics of executing the model
Divinity is currently automated by using an AWS EC2 instance. The program is executed daily before market close using a cron-job. It was initially run by hand every day before open for basic testing.
The algorithm uses a service called Alpaca, which is similar to Robin hood, to execute trades. It has no service fees, uses a simple API for sending and receiving information, and allows for paper testing using fake money in real time. Of course, “free” services are never free and Alpaca is making money using my info in more discrete ways. But this is a simple and easy method to get started.
Model performance
To explore the performance of the model you will need to read another post on my website. That post is being created at the moment but will be ready soon. It will be linked here when ready and elsewhere on the website. Make sure to check back soon and thanks for reading!